Monitoring sensors
esp32m allows to monitor sensors in real time, and also perform historical analysis by feeding sensor readings into time-series database.
Real-time monitoring
From the UI
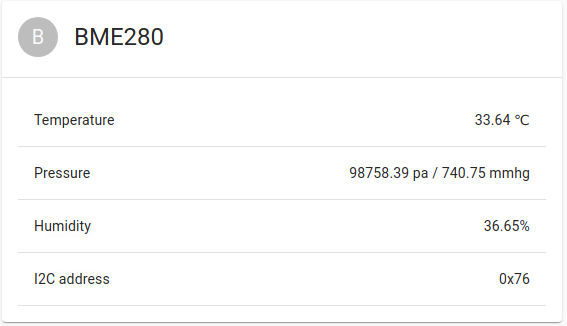
Every supported sensor has a corresponding UI module that is available from the Devices menu in the UI. UI widgets request state updates from the backend approximately every second, and you can observe changes on the Web page in real time, for example:

Using the API
MQTT
First, refer to MQTT setup tutorial page to enable MQTT data feed. Once MQTT connection is established, esp32m will start to send sensor readings over MQTT protocol automatically for every connected and configured sensor, approximately every second, in the influxdb format, for example:
- topic: esp32m/sensor/basic
- message: esp32m,unit=basic,device=BME280 temperature=33.64
WebSockets
Refer to WebSockets API reference for general guidelines. Getting sensor readings via WebSockets is as easy as issuing a state-get request, for example:
{"type":"request","target":"BME280","name":"state-get"}
esp32m responds:
{"type":"response","source":"BME280","name":"state-get","data":{"addr":118,"temperature":33.64,"pressure":98758.39,"humidity":33.65}}
Historical analysis
There are many different tools to store and analyze time-series data that may work with esp32m. In this example we will use Influxdb with Chronograph on a Debian Stretch Linux.
- Install Mosquitto server.
- Configure MQTT connection on your ESP32, use this guide.
- Install Influxdb, Telegraf and Chronograph.
- Configure Telegraf to subscribe for MQTT messages and feed them into Influxdb, in /etc/telegraf.conf
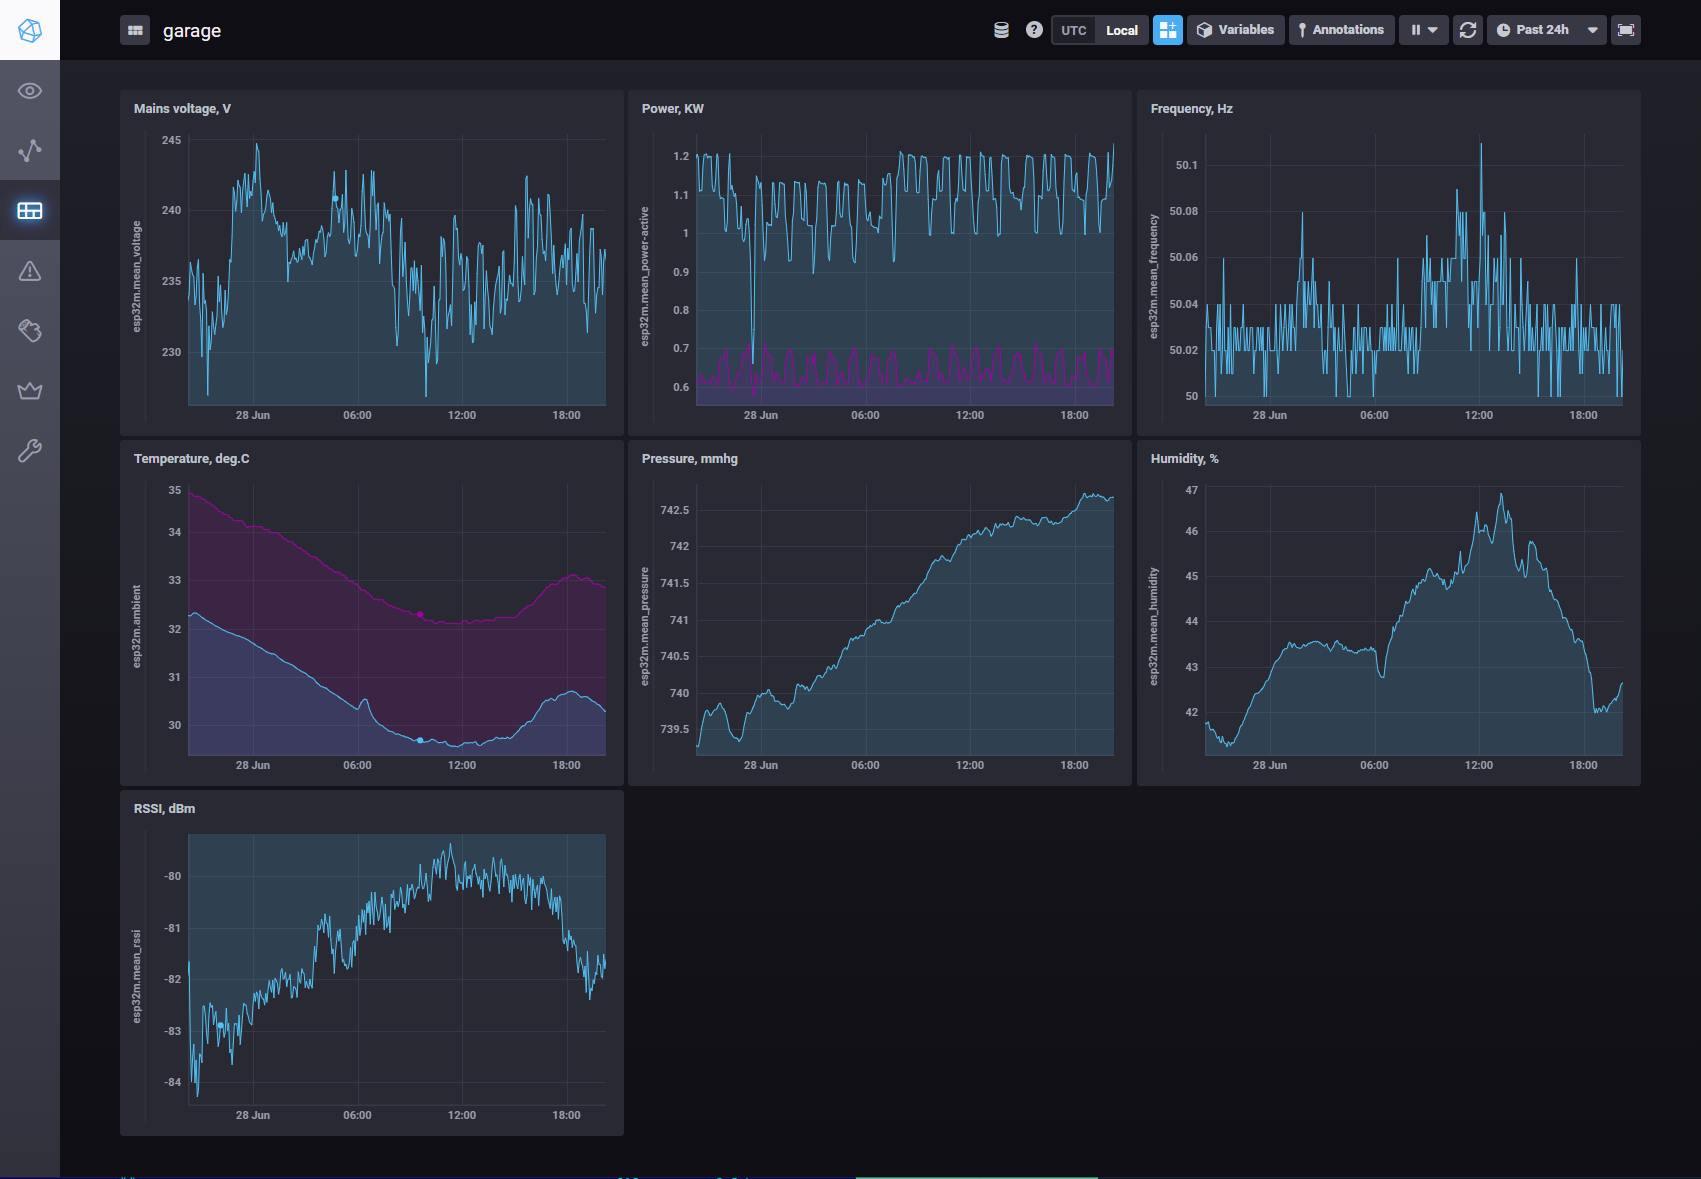
Finally, you should see something like this in your browser:
